
DAM-ROI: From Marketing Workflow to a Faster (Sales) Funnel
In practice, DAM is often marketed as a way to speed up the sales funnel, but the greatest benefits are actually found in your marketing processes and content workflows. Only once these are tightly organized will you notice that campaigns go live faster, e-commerce can adapt more quickly, and your funnel as a whole gains momentum.
A recent white paper by a leading DAM expert and trade publication (DAM News) shows that you can effectively measure this impact using smart KPIs and a pragmatic ROI approach. In this blog, we’ll show you how to build a solid ROI case for marketing workflows on your own—without needing a dedicated ROI calculator—with the sales funnel as a natural outcome.
What does DAM-ROI mean for marketing teams?
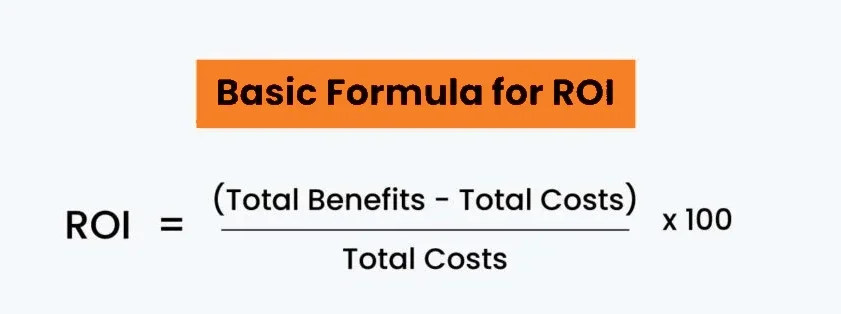
At its core, the ROI formula remains the same: (revenue − costs) ÷ costs × 100. For marketing teams, that revenue primarily comes from three areas:
Less time wasted in the content supply chain: searching, selecting, briefing, creation, review, approval, and publication.
Lower operational costs: less duplicate creation, fewer rounds of corrections, and greater reusability of assets.
Less risk and waste: consistent branding, fewer licensing errors, and better insight into which content is actually performing well.
It is precisely during the decision-making phase of a DAM project that the DMU wants to see how this will impact marketing KPIs such as time-to-market, the number of campaigns per year, and cost per campaign—and only then for sales and e-commerce.
How DAM Accelerates Marketing Workflows
Without a DAM, the marketing workflow is often a patchwork of network drives, cloud folders, email threads, and disparate tools. This slows down every step: one person searches for an image, another requests a new version, approvals get stuck, and no one is sure which asset is the “right” one.
A mature DAM solution brings structure to this by:
To provide a single, searchable library containing up-to-date assets and rights information.
Automate workflows for briefings, version control, review, and approval, and integrate them with your existing tools (CMS, marketing automation, PIM, project management).
Automate repetitive tasks such as resizing, creating formats, and generating variations, so that creative teams can focus on concept and quality.
The result: campaigns and content move through the internal workflow more quickly, allowing the marketing team to produce more output with the same resources and spend less time putting out fires. This increased pace translates into faster launches, better alignment with the market, and more opportunities to effectively feed the sales funnel and e-commerce channels.
Average savings on marketing processes
Existing DAM calculators and studies for marketing and content teams show similar ranges. You can use these as a conservative starting point:
Spend 60–70% less time searching for, gathering, and sharing assets.
20–40% lower content production costs due to reuse, less rework, and fewer ad hoc assignments.
20–30% shorter time-to-market for campaigns thanks to streamlined workflows and well-designed integrations.
For marketing departments, this often translates to: more campaigns per year, shorter turnaround times, fewer hours spent with external agencies, and more efficient use of the budget. And as that content reaches the market faster and more consistently, sales funnel KPIs such as lead conversion, pipeline velocity, and e-commerce conversion are indirectly boosted.
KPIs for measuring DAM success in marketing
The white paper emphasizes that a DAM without KPIs seems like little more than a cost center; with the right KPIs, it becomes a powerhouse for marketing performance. Thanks to audit trails and logging, you can see exactly who is doing what with which assets—a goldmine for a solid ROI case.
Key KPIs for marketing processes
The following KPIs, among others, are important for marketing processes:
Search time per user per day and its decline following the implementation of DAM.
Search success rate: the percentage of searches that result in a usable asset.
Turnaround time per campaign or content type: from briefing to publication, before and after DAM.
Asset utilization: the portion of your library that is actually used in campaigns and channels.
Number of revision rounds and rejected assets per campaign.
By linking these KPIs to marketing goals (such as “30% shorter campaign lead time” or “20% increase in campaign asset reuse”), you immediately demonstrate how DAM contributes to speed, quality, and effectiveness.
Calculate DAM ROI yourself for marketing teams
Online calculators from various providers all use a similar formula: time saved × hourly rate × number of people + reduced external costs. You can easily do this yourself, and the result is often more convincing because you’re using your own assumptions.
1. Determine the hourly cost for marketing and content
For each relevant team (marketing, creative, web/e-commerce, local marketing), use a realistic all-inclusive hourly rate. It’s better to err on the low side than the high side; finance teams are quick to spot inflated figures.
2. Estimate the time saved per step
Use average bandwidth figures, and refine them through interviews or brief time measurements.
Example for a marketing team:
25 employees regularly work with assets.
Currently, they spend an average of 45 minutes a day searching, reviewing, consulting, and preparing assets for various channels.
With a DAM and good metadata, it’s realistic to expect these tasks to take 50–60% less time.
Expect 50%:
0.375 hours per day × 4 days (using a conservative estimate) × 48 weeks × 25 people ≈ 1,800 hours per year.
At 70 euros per hour, that amounts to 126,000 euros in potential time savings on “asset handling” alone.
Add to that savings such as:
Lower external production costs (for example, 20% fewer stock photos or agency hours).
Fewer rounds of revisions and rush jobs, which often has an immediate impact on agency invoices and internal overtime.
3. Deduct DAM costs and calculate ROI
On the other hand, you have the total annual DAM costs: licenses, implementation (amortized over several years), training, and management.
Formula:
Net revenue = total savings − total costs.
ROI = net revenue ÷ total costs × 100%.
This won’t give you an exact science, but it will provide a scenario you can discuss in very concrete terms: “Based on conservative estimates, we’ll recoup this investment in about X months, and after that, it will generate Y euros per year on a recurring basis.”
Impact on e-commerce and sales funnels
When marketing delivers content more quickly and consistently, e-commerce automatically becomes more agile. New products, campaigns, and promotions no longer have to wait for assets that are scattered all over the place; instead, they are fed from a single source.
Specifically, this is reflected in:
Faster listing of new products, since images, videos, product descriptions, and specifications are available centrally.
Fewer errors in visuals and pricing, because all channels (website, app, marketplaces, social media) use the same, approved assets.
Better testing and optimization of content, because you can see exactly which assets are converting and which aren't.
All of this shortens the time between “idea” and “live in the store” and makes it easier to run funnel experiments—from A/B tests to seasonal campaigns. The ROI of DAM in e-commerce thus lies in both operational efficiency and additional revenue opportunities.
ROI is more than just hours multiplied by the hourly rate
The white paper warns against overly simplistic ROI calculations based solely on hours. Especially in marketing, it is important to also consider:
Risk mitigation (fire, compliance, licensing).
Enhanced brand experience and consistency across all touchpoints.
Strategic agility: responding more quickly to market opportunities without constantly getting bogged down by content.
A credible ROI case therefore combines tangible cost savings with improvements in KPIs and a clear narrative on risk and brand value—exactly the level at which C-suite decisions are made.
Ready to calculate your own DAM ROI?
Would you like to see what a DAM system can do specifically for your marketing team and e-commerce channels? Gather your current metrics (team size, search time, campaign turnaround time, production costs), and together we’ll develop a realistic ROI scenario to achieve measurable time savings and cost reductions within a few months.
Frequently Asked Questions About DAM ROI and Marketing Workflows
-
You calculate DAM ROI by comparing all annual savings (time savings × hourly cost × number of users plus lower production and administrative costs) with the total DAM costs and applying the ROI formula to that figure.
-
Key KPIs include search time per user, search-to-download ratio, turnaround time per campaign, asset utilization, number of revision rounds, and user adoption (active users and login frequency).
-
DAM streamlines workflows by centralizing and making all assets searchable, automating review and approval processes, and handling routine tasks—such as resizing or creating variations—automatically through integrations with your existing tools.
-
In e-commerce, DAM enables faster product and campaign rollouts, consistent assets across all channels, and more effective testing of visuals, which indirectly leads to higher conversion rates and a faster sales funnel.
-
Combine tangible time savings with concrete cost savings (production, agencies), complement that with risk reduction and brand consistency, and back it all up with KPI data from the DAM audit trail rather than just estimates.